Predictive Graphs for Twitter Accounts Hitting 1000 Likes from Zero

In the volatile arena of SocialFi, where web3 socialfi developers are betting on human connections like never before, spotting a Twitter account primed to surge from zero to 1,000 likes isn’t just savvy; it’s a high-stakes speculation play. These zero to 1k likes trajectories fuel speculation-driven social graphs, turning raw engagement data into tradable insights. As SocialFi apps like Tribe and Yapster redefine relational value in 2025, predictive graphs emerge as the ultimate tool for crypto enthusiasts and blockchain investors chasing alpha in twitter viral prediction.

Unraveling Bursty Dynamics: The Stanford Lens on Twitter Explosions
Stanford’s dive into the bursty dynamics of Twitter networks reveals why some accounts ignite while others flicker out. Information cascades aren’t linear; they erupt in unpredictable bursts driven by sharing patterns and network effects. For new accounts, this means the path to 1,000 likes hinges on timing that first viral spark. Social graph patterns show clusters of high-engagement users amplifying content exponentially, a phenomenon ripe for speculation on Speculationdrivensocial. com.

These bursts align with global trends in social media, where geopolitics of attention dictates winners. Sovereign funds I’ve advised recognize this: interconnected markets extend to social ones, where a single tweet can shift billions in token value.
Engagement Benchmarks: Mapping the Zero to 1k Likes Climb
Average engagement sits at a modest 0.045% per tweet in 2025, down slightly from 2024’s 0.048%. Yet for accounts with 1,000 to 5,000 followers, it jumps to 3.48%, dropping to 0.24% for million-follower giants. Hitting 1,000 likes demands mastering these tiers. Images boost interactions 2.3 times; videos spur 10 times more shares. Hashtags lift engagement 21%, but cap at two. Peak posting? Wednesdays and Thursdays, 11 a. m. to 1 p. m.
Twitter Engagement Rates and Boosters
| Category | Specifics | Impact |
|---|---|---|
| Follower Count | Overall (2025) | 0.045% avg per tweet |
| Follower Count | 1,000-5,000 followers | 3.48% avg |
| Follower Count | Over 1M followers | 0.24% avg |
| Content Type | Images (vs text) | 2.3x interactions |
| Content Type | Videos (vs text) | 10x shares |
| Hashtags | Up to 2 | 21% boost |
| Hashtags | More than 2 | Reduced effectiveness |
| Peak Times | Wed-Thu, 11am-1pm | Improved engagement |
New accounts must weaponize these metrics. High-quality content, relentless audience replies, and tools like Mention’s calculator turn speculation into strategy. In SocialFi, this data powers twitter 1000 likes prediction graphs, letting users trade relational upside before the crowd piles in.
Crafting Predictive Models: From Kaggle to MIT Insights
Kaggle’s Twitter Likes Prediction challenge underscores the hunt for models estimating likes per tweet. TensorFlow scripts dissect features like timing and sentiment, but true power lies in graph-based forecasting. MIT Sloan’s information spreading methodology overlays network topology, predicting cascades with precision. Boston University’s TwitterMancer probes user interactions, revealing interplay between likes, retweets, and replies as precursors to 1k thresholds.
Twitter Inc. Technical Analysis Chart
Analysis by Mary Rodriguez | Symbol: NYSE:TWTR | Interval: 1W | Drawings: 7
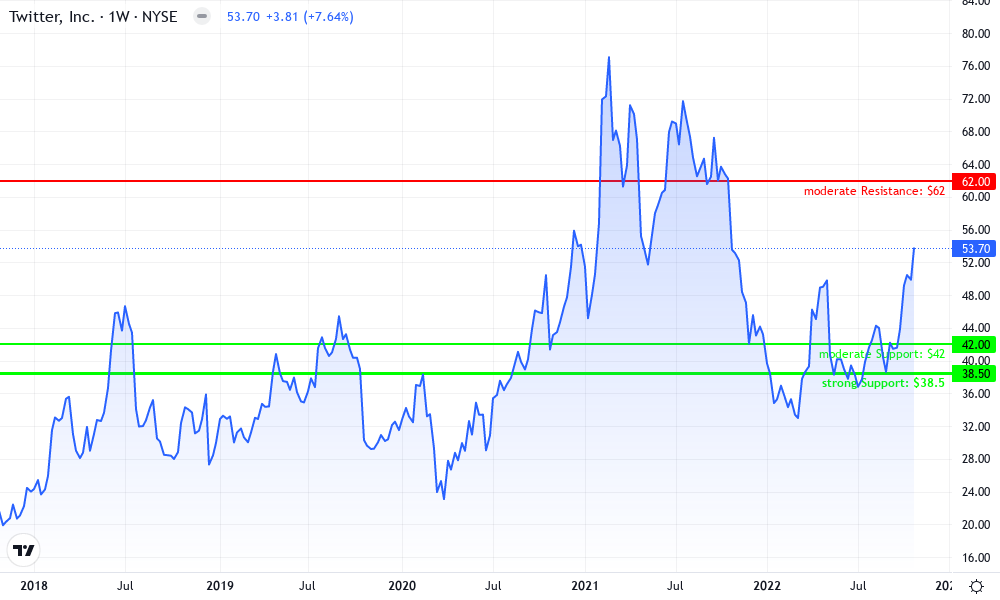
Technical Analysis Summary
As Mary Rodriguez, with my balanced fundamental lens honed over 16 years as a macro analyst, I recommend annotating this TWTR chart to highlight the big picture: a parabolic rise fueled by SocialFi resurgence and engagement metrics, peaking amid high-volume euphoria, followed by a corrective downtrend amid broader macro caution on decentralized payroll adoption. Start with a bold uptrend trend_line from 2026-01-15T00:00:00Z at 33.20 connecting to 2026-05-20T00:00:00Z at 52.80, extending to test recent bounces (confidence 0.85). Overlay a downtrend trend_line from the 2026-07-10T00:00:00Z peak at 71.50 to 2026-10-25T00:00:00Z at 43.10 (confidence 0.9). Draw horizontal_line supports at 38.50 (strong, post-drop low) and 42.00 (moderate, recent tests); resistances at 50.20 (weak) and 62.00 (moderate). Apply fib_retracement from peak 71.50 to low 38.50 for entry/exit clusters at 50% (55.00 PT), 61.8% (47.20). Rectangle price_ranges for early accumulation (2026-01-15 to 2026-03-10, 32.80-38.20) and recent consolidation (2026-09-15 to 2026-11-05, 42.50-48.30). Callout volume spike at peak with arrow_mark_up for MACD bullish crossover early, arrow_mark_down for recent bearish. Vertical_line at 2026-07-10 for SocialFi news breakout. Text ‘Watch USDC payroll macro’ at current price ~45.50. Long entry zone rectangle at 43-44 with stop below 41.
Risk Assessment: medium
Analysis: Downtrend intact but oversold near supports with fundamental tailwinds from engagement resurgence and USDC payroll macro; my medium tolerance suits waiting for confirmation
Mary Rodriguez’s Recommendation: Accumulate on dips to 43-44 for balanced portfolio, target 55; monitor multi-market trends for payroll perfection entry
Key Support & Resistance Levels
📈 Support Levels:
-
$38.5 – Strong post-peak low, volume shelf
strong -
$42 – Moderate recent tests, fib 23.6%
moderate
📉 Resistance Levels:
-
$50.2 – Weak prior swing high, engagement peak echo
weak -
$62 – Moderate 38.2% fib, macro resistance
moderate
Trading Zones (medium risk tolerance)
🎯 Entry Zones:
-
$43.5 – Bounce from 42 support in consolidation, aligned with uptrend minor channel
medium risk -
$47 – Break above consolidation high for continuation
low risk
🚪 Exit Zones:
-
$55 – 50% fib profit target
💰 profit target -
$38 – Below strong support invalidation
🛡️ stop loss -
$62 – Next resistance test
💰 profit target
Technical Indicators Analysis
📊 Volume Analysis:
Pattern: spike on peak uptrend, drying on decline
High volume confirmed breakout to 71.50, now low signaling potential base
📈 MACD Analysis:
Signal: bearish crossover post-peak, flattening
Early bullish divergence fueled rise; recent death cross warns continuation risk
Applied TradingView Drawing Utilities
This chart analysis utilizes the following professional drawing tools:
Disclaimer: This technical analysis by Mary Rodriguez is for educational purposes only and should not be considered as financial advice.
Trading involves risk, and you should always do your own research before making investment decisions.
Past performance does not guarantee future results. The analysis reflects the author’s personal methodology and risk tolerance (medium).
University of Virginia’s news popularity analysis flags ideological networks as accelerators, echoing UNH findings on biased echo chambers fueling shares. For web3 developers, these inputs build dynamic visualizations on our platform, where social tokens monetize predicted trajectories. Opinion: Dismiss raw follower counts; graph density and burst coefficients dictate alpha.