
Defining speculation-driven social graphs
Social networks are no longer just communication platforms; they are becoming predictive engines for financial speculation. This shift redefines how market participants interpret data, where every like, share, and comment is processed as a high-frequency trading signal. In this new paradigm, sentiment velocity—the speed at which a narrative spreads—often predicts asset price movement more accurately than traditional fundamental analysis.
This model challenges the Efficient Market Hypothesis by suggesting that public discourse itself generates alpha. Research indicates that social network metrics can serve as leading indicators for capital market decisions [1]. When a specific stock or crypto asset gains traction in online communities, the resulting surge in attention creates a feedback loop. Traders monitor these social graphs to identify momentum before it appears on traditional order books.
The distinction between traditional investing and this speculative model lies in the timeframe and the data source. While conventional analysis relies on earnings reports and macroeconomic data, speculation-driven strategies rely on the digital footprint of retail and institutional investors. As noted in financial literature, speculation involves engaging in high-risk transactions aimed at short-term price fluctuations [2]. Social graphs provide the real-time pulse needed to navigate these fluctuations, turning public opinion into a tradable commodity.
This dynamic is particularly visible in volatile assets where sentiment outweighs fundamentals. The graph structure allows algorithms to map influence networks, identifying key nodes—such as influential traders or media outlets—that can move markets. By tracking these connections, traders can anticipate shifts in liquidity and price action, effectively using the social graph as a radar for market sentiment.
Identifying Experts in the Noise
Algorithms now function as digital filters, distinguishing genuine market insight from speculative noise. Rather than treating all user-generated content equally, these systems analyze network topology to identify authoritative voices. By mapping connections between users, the platform can trace how information flows and verify the credibility of early signals. This process relies on graph-based methods that transform limited expert predictions into actionable data points.
The core mechanism involves dynamic attribute analysis. Algorithms evaluate not just what an expert says, but who listens and how the message spreads. A dynamic attributes-driven graph attention network allows the system to weigh recent activity against historical accuracy. This prevents legacy reputation from overshadowing current, relevant insights while filtering out accounts that simply amplify trends without adding substance.
This approach mirrors the semi-strong form of the Efficient Market Hypothesis, where public information is quickly reflected in prices. However, social graph algorithms operate faster, identifying sentiment shifts before they hit traditional financial news. By prioritizing voices with verified track records and dense, high-quality connections, the system reduces the lag between speculation and market reaction.
To see this in action, consider the correlation between social sentiment spikes and asset price movements. When algorithmic trust identifies a cluster of high-reputation analysts discussing a specific sector, the resulting price action often precedes broader market adoption.
Viral engagement metrics as market signals
Use this section to make the Speculation-Driven Social Graphs decision easier to compare in real life, not just on paper. Start with the reader's actual constraint, then separate must-have requirements from details that are merely nice to have. A practical choice should survive normal use, maintenance, timing, and budget. If a recommendation only works in an ideal situation, call that out plainly and give the reader a fallback path.
| Factor | What to check | Why it matters |
|---|---|---|
| Fit | Match the option to the primary use case. | A good deal still fails if it does not fit the job. |
| Condition | Verify age, wear, and service history. | Hidden condition issues erase upfront savings. |
| Cost | Compare purchase price with likely upkeep. | The cheapest option is not always the lowest-cost option. |
Social sentiment analysis in practice
Use this section to make the Speculation-Driven Social Graphs decision easier to compare in real life, not just on paper. Start with the reader's actual constraint, then separate must-have requirements from details that are merely nice to have. A practical choice should survive normal use, maintenance, timing, and budget. If a recommendation only works in an ideal situation, call that out plainly and give the reader a fallback path.
The simplest way to use this section is to write down the must-have criteria first, then compare each option against those criteria before weighing nice-to-have features.
Navigating the 2026 Speculative Landscape
Speculation in 2026 is no longer just about asset fundamentals; it is about network velocity. Social graphs now amplify price movements before official data can confirm them, creating a feedback loop where sentiment drives valuation, which in turn reinforces sentiment. For investors and analysts, this shift requires a disciplined approach to signal verification rather than reactive trading.
Social graphs often create a "noise floor" where retail enthusiasm masks underlying weakness. Do not trade on social volume alone. Instead, treat social metrics as a leading indicator of volatility, not direction. Cross-reference trending topics with actual on-chain volume or exchange inflows. If social mentions spike but liquidity remains static, the move is likely a manipulation trap rather than a genuine market shift.
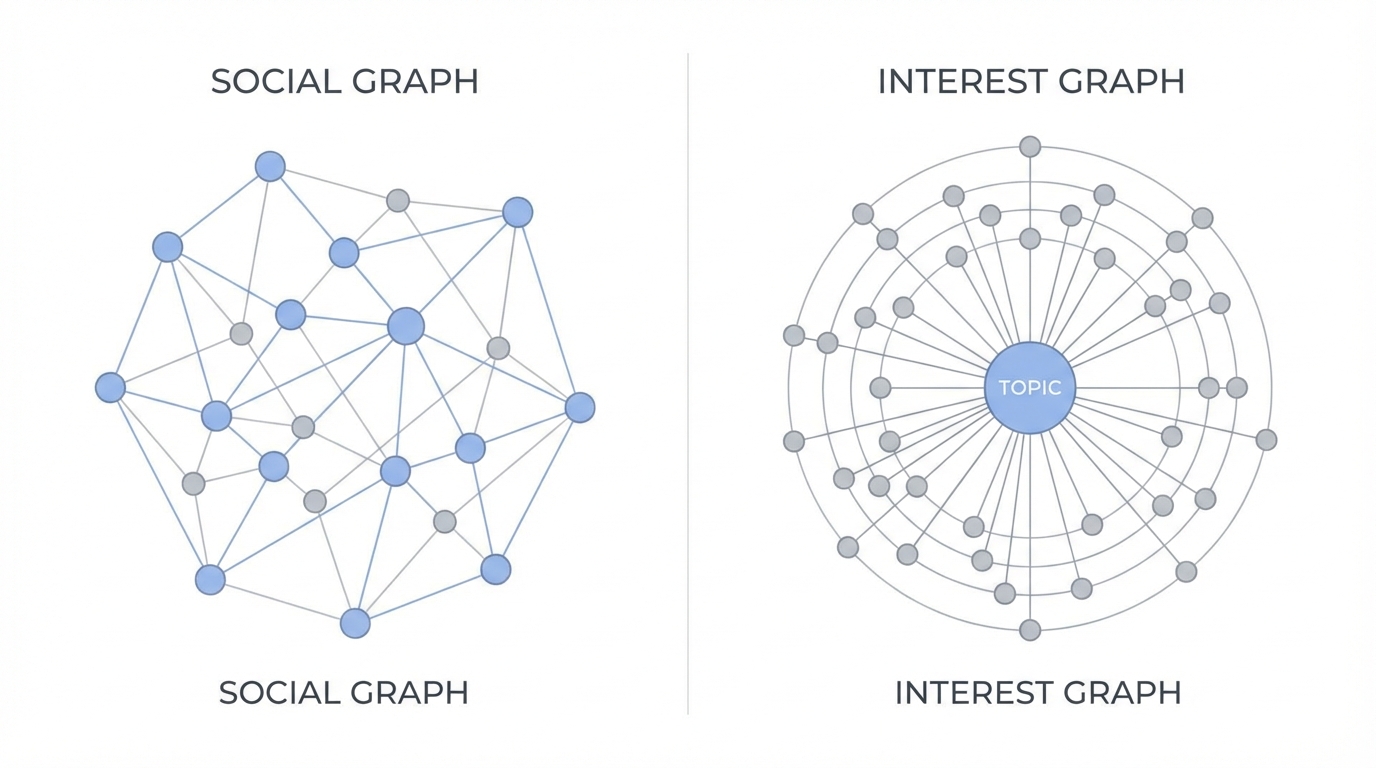
The Efficient Market Hypothesis suggests prices reflect all available information, but social graphs compress time. Information travels faster than official corporate disclosures or macroeconomic reports. When a social narrative erupts, pause before acting. Wait for confirmation from primary sources: SEC filings, central bank announcements, or verified exchange data. This lag is your buffer against being the "exit liquidity" for early manipulators.
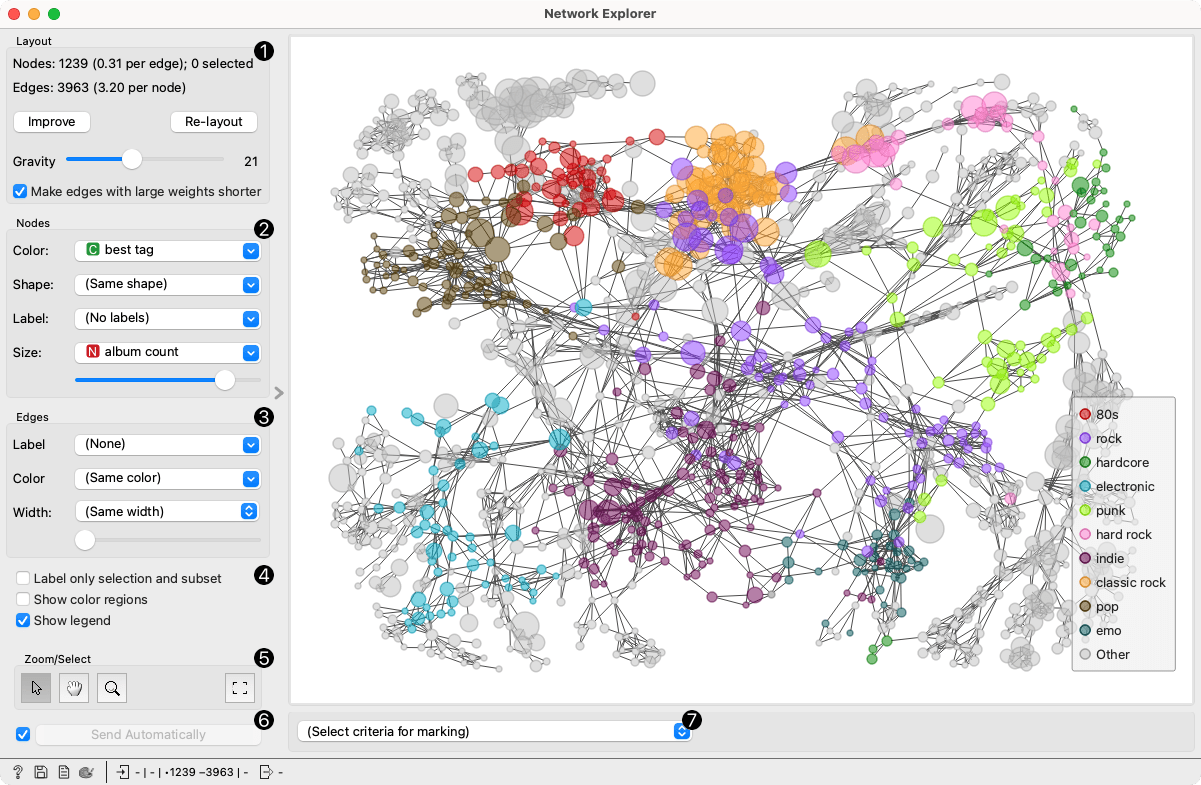
In a decentralized-looking social graph, influence is often highly centralized. Identify the few accounts or entities driving the initial narrative. If a single influencer or a coordinated bot cluster is pushing a specific token or stock, the risk of a "pump and dump" is elevated. Use network analysis tools to trace the origin of the hype. If the graph shows a hub-and-spoke structure with no organic community roots, treat the asset as speculative noise.
The core challenge in 2026 is distinguishing between organic community growth and engineered hype. Organic growth shows gradual, sustained engagement across diverse nodes. Engineered hype shows sudden, synchronized bursts of activity from low-reputation accounts. By focusing on the structure of the graph rather than just the volume of the chatter, you can avoid the most common pitfalls of speculative trading.
Frequently Asked Questions on Speculation
What is a good example of speculation?
Speculation involves high-risk financial transactions aimed at profiting from short-term price fluctuations rather than intrinsic value. A clear example is buying a social token or meme stock based solely on viral momentum and community sentiment, with the intent to sell before the hype fades. Unlike investing, which relies on fundamental analysis of earnings or cash flow, speculative trades depend on predicting market psychology and liquidity dynamics.
Is a stock market crash imminent in 2026?
No analyst can predict market crashes with certainty, as they are often triggered by unpredictable systemic shocks or rapid sentiment shifts. While social graph volatility can amplify downturns, relying on speculative timing is dangerous. Instead of forecasting a specific crash date, focus on risk management strategies such as diversification and position sizing to withstand inevitable market corrections.
What are the three forms of the Efficient Market Hypothesis (EMH)?
The Efficient Market Hypothesis posits that asset prices reflect all available information. It has three forms:
- Weak Form: Prices reflect all past market data (e.g., historical prices). Technical analysis is ineffective.
- Semi-Strong Form: Prices reflect all publicly available information (e.g., earnings reports). Fundamental analysis is ineffective.
- Strong Form: Prices reflect all public and private (insider) information. No investor can consistently beat the market. In speculation-driven social graphs, the weak and semi-strong forms are often challenged by the speed of information diffusion, suggesting that markets may not always be fully efficient in real-time.
What is speculation in economics?
In economics, speculation is the act of taking on risk in the hope of profiting from price changes. Speculators provide liquidity to markets, which can help stabilize prices, but they can also exacerbate volatility if their actions become herd-like. The distinction between speculation and gambling lies in the analysis of risk; speculators typically use data and models to assess probability, whereas gamblers rely purely on chance.
No comments yet. Be the first to share your thoughts!