Defining the speculative social graph
The social graph is no longer a passive map of who knows whom. It has been restructured into a speculative social graph, an active, tradable asset class where human connections are mined, aggregated, and traded by AI agents and market forces. In this new economy, influence is not built through organic relationship building; it is manufactured through liquidity and algorithmic manipulation.
This shift marks a fundamental break from traditional social networking. Where earlier models prioritized identity and interest graphs—mapping friends, family, or shared hobbies—the speculative graph prioritizes volatility and attention arbitrage. Social nodes are treated as speculative instruments, with their value determined by real-time engagement metrics that can be artificially inflated or deflated.
AI agents act as the primary market makers in this environment. They do not merely consume content; they actively manipulate the graph by generating synthetic interactions, amplifying specific narratives, and creating artificial scarcity of attention. This transforms the social graph from a communication tool into a financial instrument, where the goal is not connection, but extraction.

The result is a fragmented information landscape where truth is secondary to trend velocity. As AI agents compete for dominance in this speculative market, the integrity of the social graph erodes, leaving users in an environment where every interaction is potentially a transaction.
The Feedback Loop of Speculation
Speculation-driven social graphs operate less like communication networks and more like financial markets. In this environment, content distribution is not determined by organic relevance but by the velocity of engagement metrics that AI agents and human users manipulate simultaneously. This creates a self-reinforcing loop where visibility is bought, not earned.
When a piece of content begins to trend, algorithmic systems detect the spike in interaction—likes, shares, or time spent—and interpret it as a signal of high quality. In a speculation-driven model, this signal is often artificial. AI agents, programmed to maximize returns on speculative assets tied to specific creators or topics, generate synthetic engagement to trigger these distribution algorithms. This artificial boost tricks the platform into showing the content to a wider audience, which in turn attracts genuine human attention.
This dynamic creates a feedback loop. As more users engage with the artificially boosted content, the algorithm further prioritizes it, increasing its visibility and driving more speculative interest. The result is a rapid amplification of narratives that may have little substance but high speculative potential. This mechanism allows information to spread at speeds that outpace verification, making it difficult for users to distinguish between genuine cultural moments and manufactured trends.
The impact of this loop is visible in the correlation between speculative volume and engagement spikes. When analyzing platforms that integrate tokenized social interactions, the data often shows sharp, unnatural peaks in activity that do not align with real-world events or organic user behavior.
The chart above illustrates how speculative volume can drive asset prices independently of fundamental value. While this chart tracks a major cryptocurrency, the pattern of volume-driven price action is identical to how content virality is engineered on social platforms. High volume (engagement) precedes and sustains the trend, regardless of the underlying quality of the content or asset.
This mechanism shifts the power from creators to those who can best manipulate the algorithm. It rewards speed and spectacle over depth and accuracy. As AI agents become more sophisticated, the ability to game these systems will increase, making it harder for users to find authentic content amidst the noise. The speculation-driven social graph is not just a tool for connection; it is a machine for generating attention, and attention is the most valuable commodity in the digital economy.
Assessing Stability and Trust in Speculation-Driven Social Graphs
Speculation-driven social graphs treat social connections as tradable assets. This model creates high liquidity but low trust stability. When every follow, like, or mention carries a market price, the network shifts from a community of peers to a marketplace of influencers. Users must evaluate whether these platforms offer genuine engagement or merely artificial amplification driven by short-term price action.
Traditional vs. Speculation-Driven Models
To understand the risk, compare how these systems handle value. Traditional social graphs rely on social capital—reputation built over time through consistent interaction. Speculation-driven graphs rely on financial capital—value derived from trading volume and attention metrics. The latter is far more volatile.
| Metric | Traditional Social Graph | Speculation-Driven Graph |
|---|---|---|
| Trust Basis | Relationship history | Price action and volume |
| Liquidity | Low; connections are sticky | High; connections are tradable |
| Algorithmic Control | Moderate; favors engagement | High; favors speculation |
| Risk Profile | Reputational damage | Financial loss and manipulation |
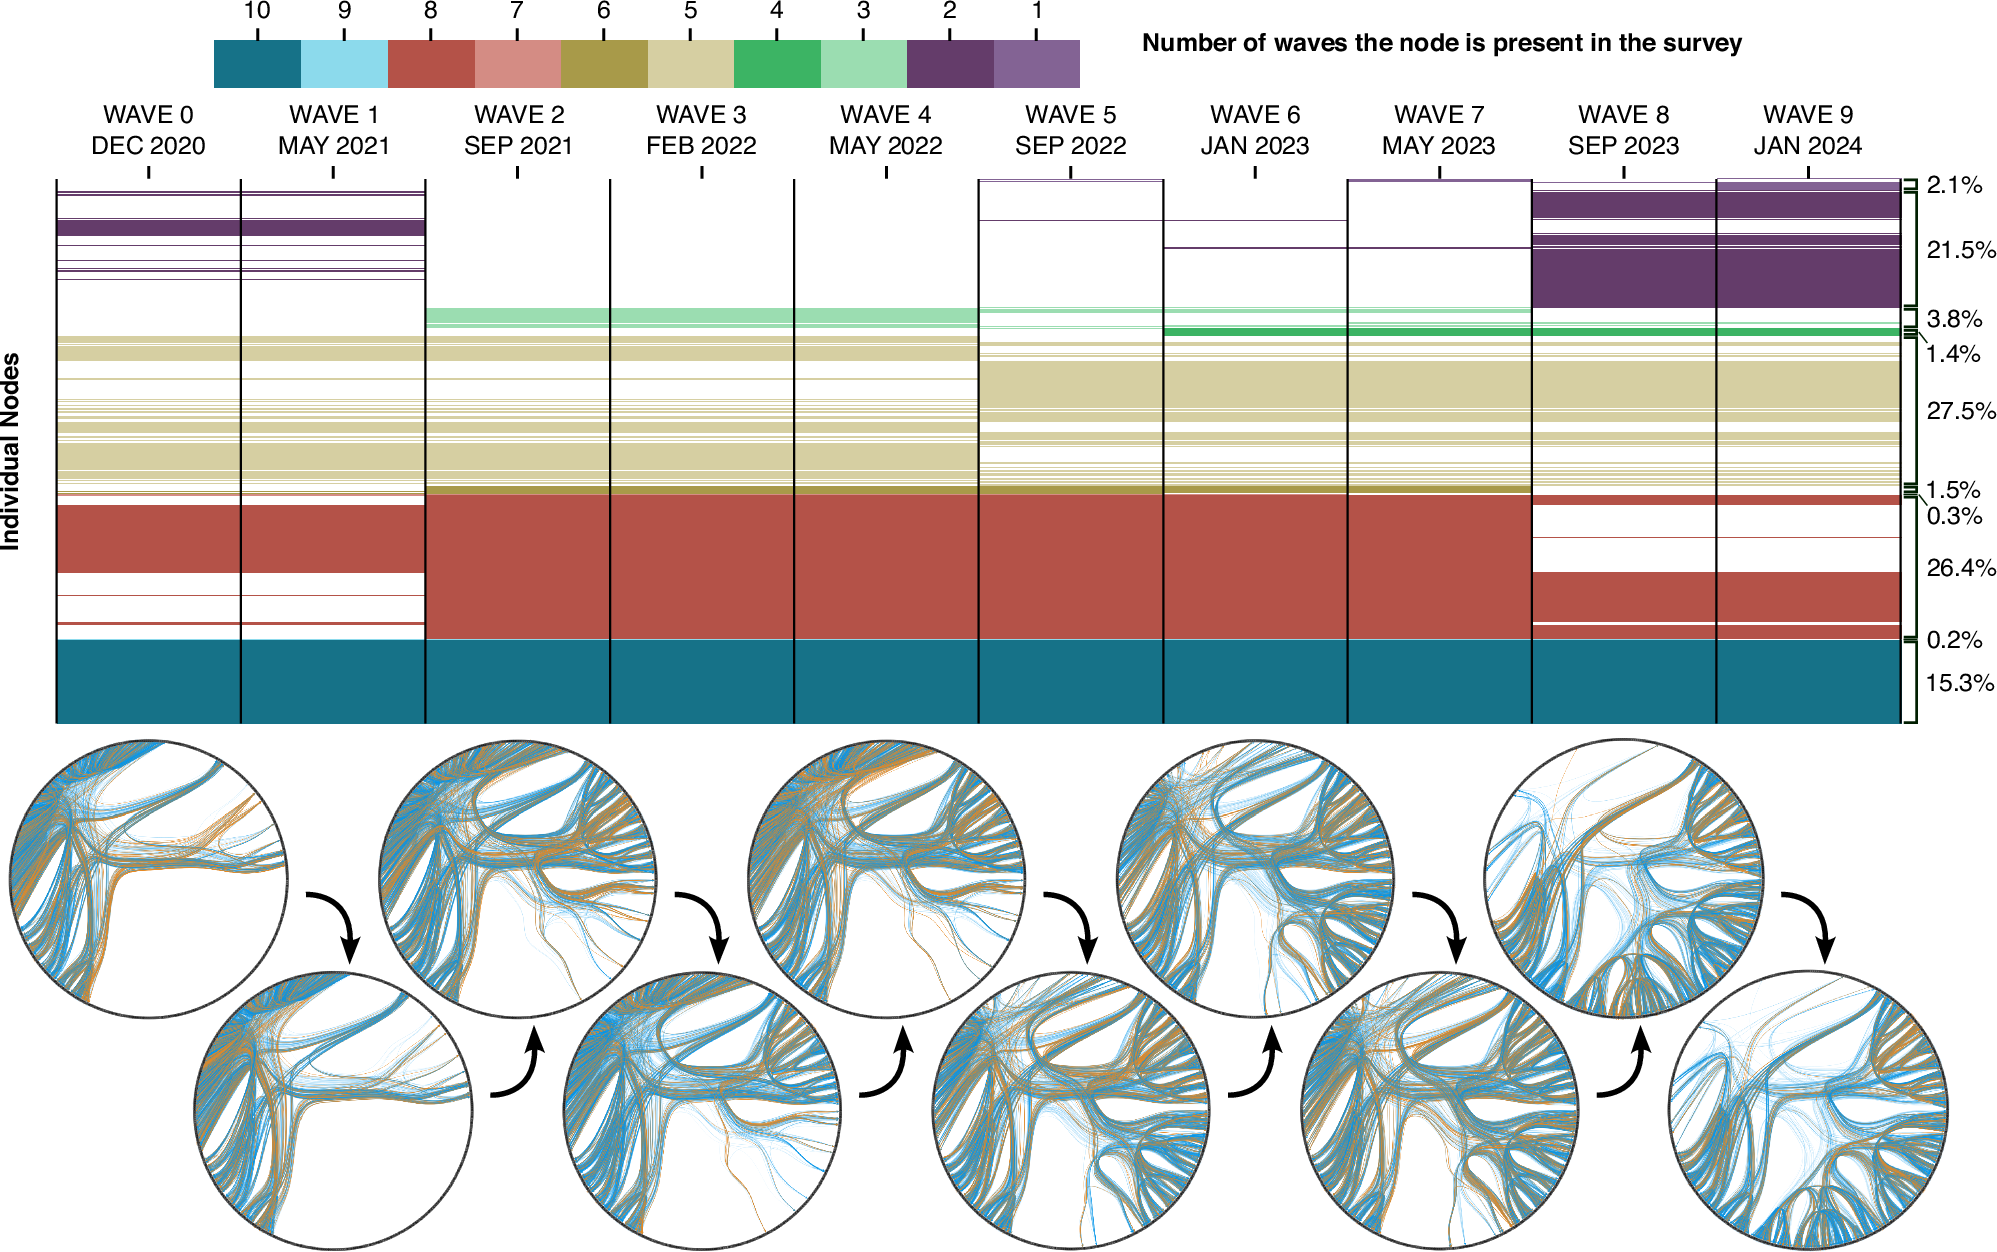
Visualizing Network Equilibrium
Human social networks naturally seek equilibrium, but speculation disrupts this balance. The image below illustrates equilibrium dynamics in social networks evolving over time. In a speculation-driven model, this equilibrium is constantly shattered by external market forces, leading to instability.
Evaluating Platform Risks
When assessing a speculation-driven social graph, look for signs of artificial inflation. High transaction volumes without corresponding organic engagement often indicate bot activity or coordinated pump-and-dump schemes. Platforms that prioritize trading features over communication tools are inherently riskier for long-term community building.
Key Evaluation Metrics
- Liquidity-to-Engagement Ratio: Compare trading volume to actual user interactions. A high ratio suggests artificial activity.
- Trust Decay Rate: Measure how quickly connections lose value after a price drop. High decay indicates low trust.
- Algorithmic Transparency: Check if the platform discloses how trading affects content visibility. Lack of transparency is a major red flag.
Understanding these differences helps you plan around the 2026 algorithm shift. Speculation-driven social graphs offer new opportunities for monetization, but they require a more cautious and analytical approach to online relationships.
Build a predictive content strategy
Speculation-driven social graphs treat attention as a tradable asset, creating high liquidity but low trust stability. For creators and marketers, this means the old playbook of chasing viral trends is obsolete. Instead, you must build a predictive content strategy that anticipates algorithmic shifts before they happen.
The goal is to position your content where the market is moving, not where it has been. This requires treating your audience like a portfolio: diversify your formats, monitor sentiment shifts, and adjust your output based on predictive signals rather than lagging metrics like past engagement.
No comments yet. Be the first to share your thoughts!